If the contents of this post are a outside of your wheelhouse, don’t worry, this is why I started CREXchange.io! We have free Commercial Real Estate Power BI Reports to help clients get up and off the ground with Yardi Data Integration and Advanced Power BI Custom Reports to help run your CRE business. Contact us there for more details or a demo!
1. Export and Restore your Yardi Database backup locally
The first step to be able to analyze your data is going to involve getting access to your data. Most SaaS platforms including Yardi do not allow direct access to the database or data model but most do allow for you to export this data to your local instance to do as you please. You will need to build a process that imports and restores the back up database copy to a local SQL Server. This process can be tricky, but it can be done. See our whitepapers below to get more informational on this step. You will require a SQL server license and a virtual machine to host the back up.
2. Transform the Yardi data into a usable data model
There are thousands of tables in the database, most which you will never need. Extract the handful of tables you need for your data that pertain to occupancy, revenue, properties, tenants, units and accounting and others you may need and organize this data into a data model that can be easily sliced and diced. The model can be complex so be sure to use the right ID and ensure you have similar rules and logic tied to the type id’s and param to be sure you are getting the right data for the right timeline. If you need help with this piece, reach out for more help to get access to our proprietary real estate data model.
3. Connect Power BI do your Data Model
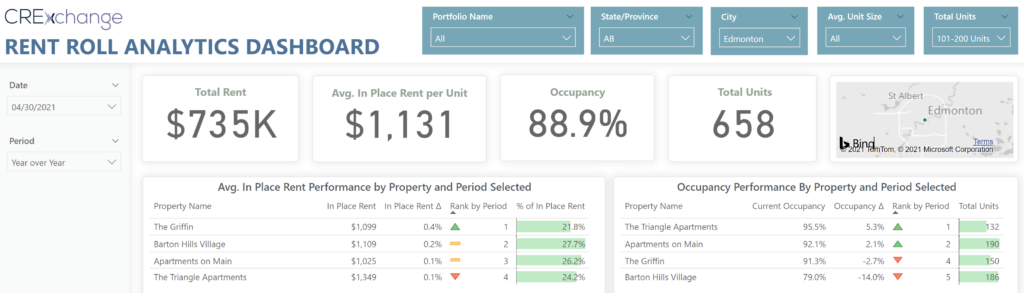
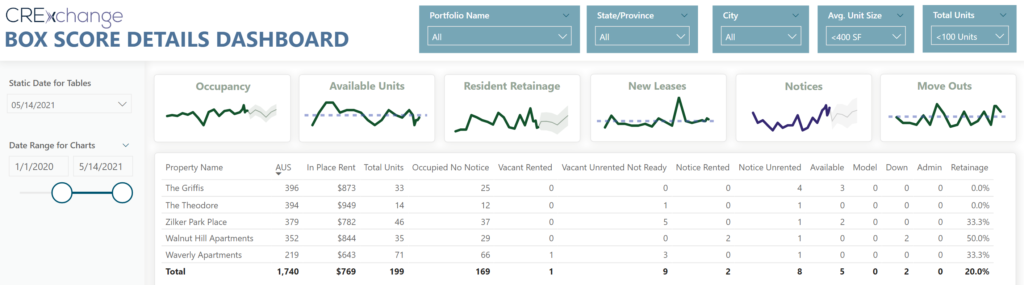
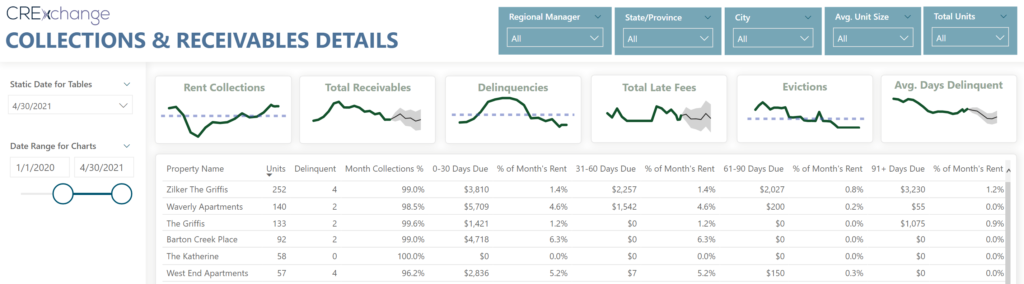
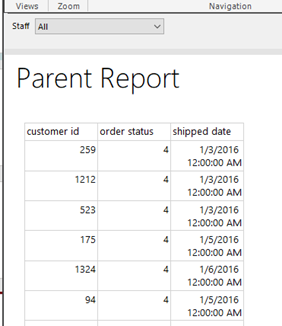
Once you have your data model created and a process to refresh and reload this data nightly, you are ready to connect your visualization tools to being building cool new reports, analytics, and visualizations. Using Power BI’s default SQL server connector, you can connect to your database weather it is on the cloud or on-prem and import the data into Power BI. Your data model should have the foreign keys establish so that it is inherited and be able to create reports and dashboards. Here is an example of one of our Reports that enables tenant and leasing data.
4. Connect Power BI to other data sources and combine to your Yardi real estate data
Having Yardi or Real Estate data is never enough. Now with Power BI, you can connect to numerous data sources in your business to begin to combine data too create analytics across all your business units and lifecycle of the real estate business.
Step 1 and 2 are the more technical heavy steps of the process. In previous post I have written white papers about getting data from Yardi nightly or even hourly using transaction log shipping, both available for download.
If the contents of this post are a outside of your wheelhouse, don’t worry, this is why I started CREXchange.io to help clients get up and off the ground with Yardi Data Integration and Advanced Power BI Custom Reports to help run your CRE business. Our reports are free with integration! Contact us there for more details or a demo!
]]>Side Note: Want to learn SQL or Python for free. In less then 10 minutes a day and less than an hour total? Signup for my free classes delivered daily right to your email inbox for free!

Now back to the article…
Setting up the Child Report
- Deploy the child Report to app.powerbi.com and run the report to obtain the URL for the report.
- This cannot be done directly from app.powerbi.com as this URL will not render when passing parameters in the URL
- Copy and paste this URL into a Notepad window
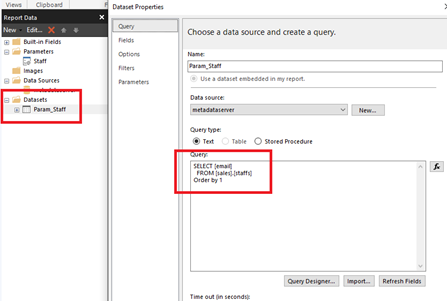
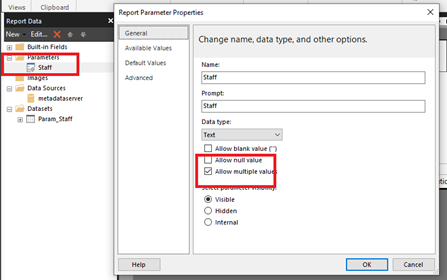
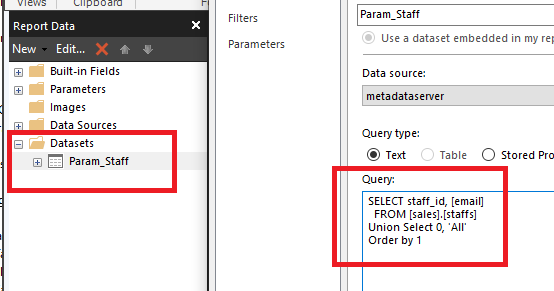
- Below are the parameter dataset query and multiselect parameter set up in the child reports.
- It is best to test with the URL before adding this to your parent record
- Paste the URL into a web browser to confirm the child reports work
- Hardcode the passing of parameters in the URL Edit the URL in notepad by adding “&rp:parametername=xyx” to the end where the parameter name is the exact same name as the name in the Report builder tool. If you need to add more, continue to add “&rp:parametername=xyx” to the string.
- I.e “https://app.powerbi.com/groups/me/rdlreports/617a3daa-0d7b-412b-9vs2-0213123123?ctid=eeb53a15-a2e4-46de-8608-22657ab58979&rp:param1=test&rp:param2=202012”
- For multiselect parameters, you can add the same parameter to the string to select multiple values “&rs:parametername=xyx&rs:parametername=xyx&rs:parametername=xyx”
Building the Parent Report
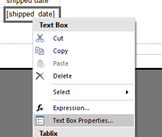
- Now that we have a working tested URL, Head back to the parent report to build the dynamic URL. In the field that needs to contain the drill to, right click the box and select “Textbox Properties”
- Select “Actions -> URL” and use the Fx to create an expression
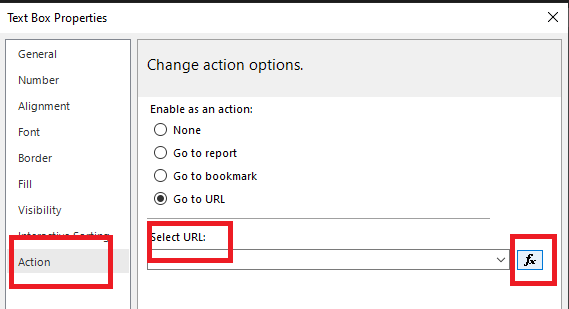
- The expression should read =”URL&rp:parametername=” + Parameters!paramtername.Value. You can use the string function to concatenate the actual parameter values on the parent report to create a dynamic URL at run time that matches what you have in your test notepad file.
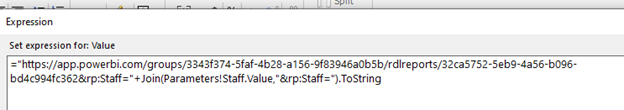
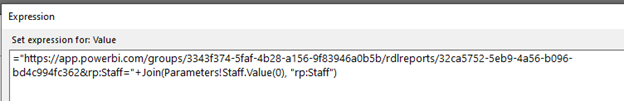
- For multlselect parameters you can append the code JOIN(Parameters!parametername.value, “rs:parametername”) and this will dynamically create a string of all the parameter values needed for the multiselect.
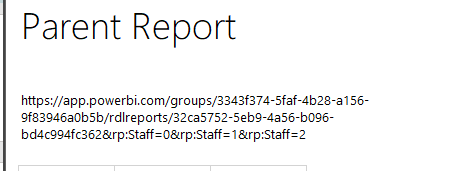
- To test, put this string in a Text box expression on the report so you can see it render at runtime to be able to export and test.
Large Multi Select Parameters
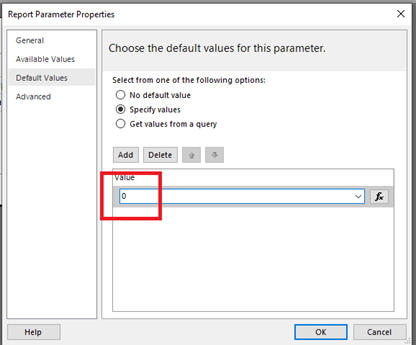
- If you have a multiselect that is large, it may exceed the 2048 characters of a URL available when generating the dynamic string. For this to work, in your parameter dataset, add a Union to a “All” value. Make “0” the default in your parameter as well, which represents the “All” value.
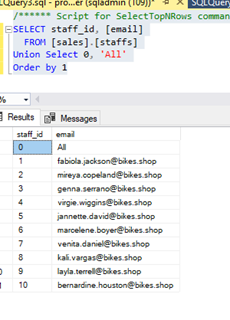
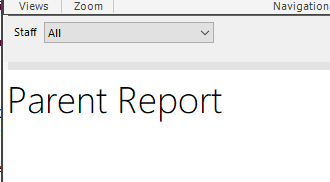
- When you run the report, the All parameter should be selected by default.
- Go back to the report to create the full select statement for the values of the report in your main query and reference the parameter with a Or Statement the uses the new default ‘All’ value.
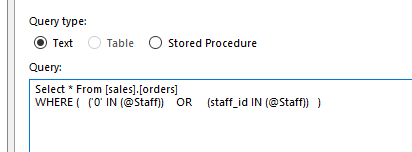
- The report will run with the default “All” value and bring back all results.
- The same logic can now be applied to the child report when the parameter value is passed down in the dynamic URL
Power BI Paginated Reports & Multi Select URL Parameters
]]>Side Note: Want to learn SQL or Python for free. In less then 10 minutes a day and less than an hour total? Signup for my free classes delivered daily right to your email inbox for free!
Now back to the article…
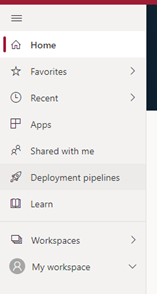
- Navigate to app.powerbi.com and select the “Deployment Pipelines” in the menu
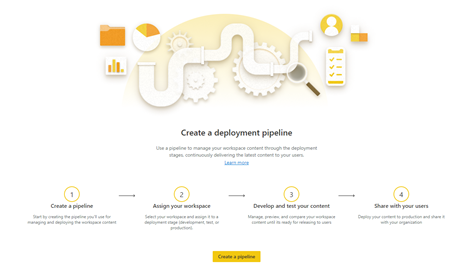
- Select “Create a pipeline”
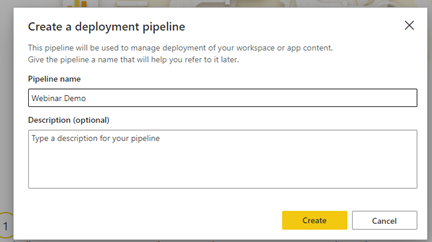
- Give the pipeline a name. For best practices, it is suggested you use the name of the Workspace you will be creating the Pipeline for.
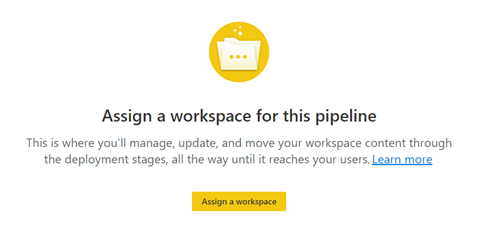
- With the workspace created the first thing to do is Assign the pipeline to a workspace. Pipelines can only be assigned a single workspace and workspaces only tied to one pipeline. If you create another pipeline, that workspace will not be selectable.
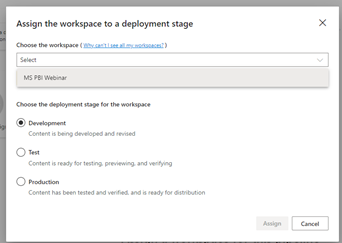
- Select the workspace you will be creating a pipeline for. You will also be asked to select what stage of the pipleline this represents. This is usually set to development as you will want to deploy to Test and Production as part of your SDLC (Software Development Life Cycle)
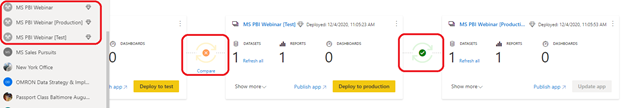
- Completing this step will create 2 new workspaces in your Power BI environment as you deploy called Workspace_Name [Test] and Workspace_Name [Production]
- In the Pipleine window, under the development section you can expand the window to see all the elements in that workspace. By selecting the items at the bottom, you can pick which items you wish to move to Test.
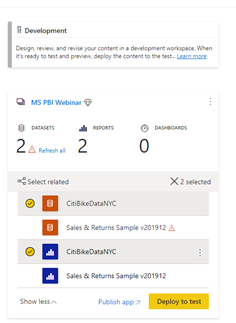
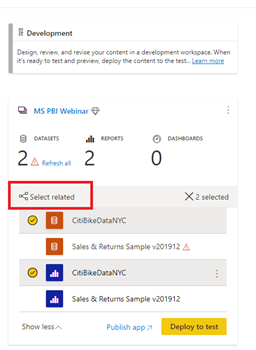
- The “Select Related” button will also work to pick out all related items incase you are missing an dependent item that needs to be deployed.
- Once you deploy to test, and deploy to production, the Pipline will create the new work spaces and move the items across.
- The Indiciator on the arrows that connect the pipelines will show if the there is a discrepancy between the environment.
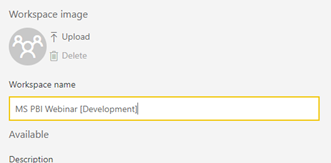
- It is best practice to rename the development workspace so that the naming convention is easy to follow.
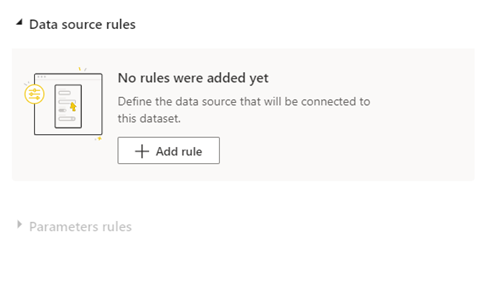
- You can change the dataset rules for each environment and set parameters by clicking on the Lightning bolt. This is handy for setting up test and production data sources for each environment.
- To Parameterize your Power BI Data source Connections, open a Power BI report and go to Transform Data and the “View” tab.
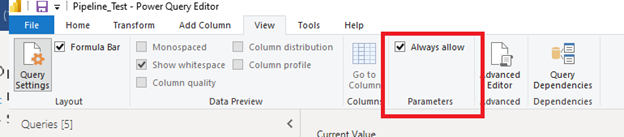
- Under parameters, set the checkbox to “Always Allow”. This will enable you to use parameters in your data source connections.
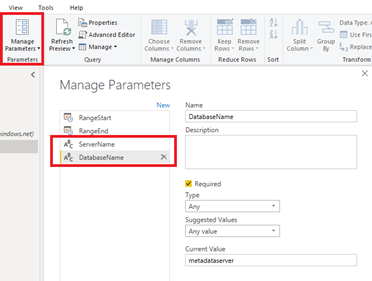
- You can now setup two parameters for the server name and the database name
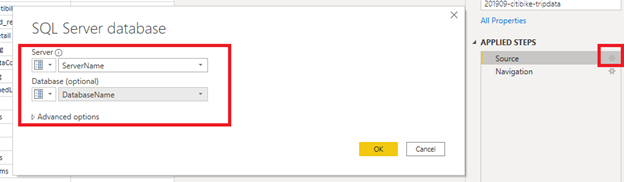
- Edit your source to now use those parameters in the Power BI report so they can be modified in the Pipeline deployments.
Setting up Power BI Deployment Pipelines and Parameters
]]>Side Note: Want to learn SQL or Python for free. In less then 10 minutes a day and less than an hour total? Signup for my free classes delivered daily right to your email inbox for free!
Now back to the article…
1. What Are Paginated Reports
Paginated reports are essentially SSRS reports that can be designed and deployed through Power BI. You have the ability to add custom logic to nearly every element and line your reports up to the exact pixels of the screen giving you total command of the look and feel which allow for quality looking reports in printing and exporting
2. How to create Paginated Reports?
You can create reports by downloading the free tool for Power BI Report Builder right to your desktop. This is a standalone tool from Power BI. These reports are compatible with the Power BI Service.
3. What Data Sources Work with Paginated Reports
There is some limited data source capabililities for Paginated Reports when comparing to the vast library of Power BI. Report data is pulled at run time and not stored in an underlying model like Power BI.
Current sources include the following
- Azure SQL Database and Data Warehouse
- Azure Analysis Services (via SSO)
- SQL Server via a gateway
- SQL Server Analysis Services via a gateway
- Power BI Premium Datasets
- Oracle
- Teradata
4. Deploying and Sharing Reports to Users
Paginated Reports can be deployed to the Power BI Service. From here you can leverage the ability to put a report in a workspace and let users subscribe to the report. Reports will be automatically emailed to users based on the subscription sending a PDF directly to the consumer.
5. Exporting Power BI Service
Paginated Reports can be exported in the following formats
- Excel
- Microsoft Word
- Microsoft
- PowerPoint
- CSV
- XML
- MHTML
6. Licensing for Paginated Reports in Power BI
Unfortunately Paginated Reports in Power BI is not free the same way you need a SQL Server licence for SSRS reports. You will will need either a License for Power BI Embedded or have a Power BI Premium Capacity P1, P2 or P3.
7. Limitations on Paginated Reports
- Reports are not interactive. Similar to SSRS, all reports are essentially static one rendered with the exception of tables that can expand and collapse
- You must pay the licence to use these in production
- No access to Custom Fonts
- No sharing data sets across reports
If you enjoyed this post on Power BI Paginated Reports vs SSRS and Tutorial and want to learn more, check out my Udemy class on getting started learning about the tool!
]]>